Brand loyalty in the smartphone industry has never been more critical.
Recent data from Consumer Intelligence Research Partners (CIRP) shows Apple’s loyalty rate has declined slightly to 89% in 2025, down from a peak of 94% in 2021, while Samsung’s loyalty has climbed to 77%¹.
This comprehensive analysis examines current loyalty trends, market dynamics, and what drives consumer retention across major smartphone brands.
Key Takeaways for 2025
- Apple Maintains Leadership: Despite a slight decline from peak levels, Apple’s 89-92% loyalty rate remains unmatched in the industry¹,²
- Samsung’s Steady Improvement: Strategic focus on AI features and reduced competition has boosted Samsung’s loyalty to 77%¹
- Ecosystem Effect: Multi-device ownership significantly increases brand loyalty, with Apple leading this trend¹⁶
- Economic Sensitivity: Extended upgrade cycles affect all brands but loyalty leaders maintain stronger retention during economic uncertainty²⁴
- Generational Divide: Younger users show higher iPhone loyalty while older demographics are more platform-agnostic¹⁵,¹⁶
- AI as Differentiator: Advanced AI features are becoming crucial for maintaining and building brand loyalty across all price segments¹⁴
Current Smartphone Brand Loyalty Rankings (2025)
| Brand | 2025 Loyalty Rate | 2021 Baseline | Change | Market Share (US) |
|---|---|---|---|---|
| Apple iPhone | 89-92%¹,² | 94%⁵ | -2% to -5% | 61.26%⁶ |
| Samsung Galaxy | 77%¹ | 68-74%⁷ | +3% to +9% | 22.63%⁶ |
| Google Pixel | 51-65%³,⁸ | 84%⁷ | -19% to -33% | 2.40%⁶ |
| Motorola | ~45%⁷ | ~55%⁷ | -10% | 3.50%⁶ |
| Xiaomi | ~60%⁹ | ~60%⁹ | Stable | 1.14%⁶ |
How Brand Loyalty is Measured?
Smartphone brand loyalty is quantified through multiple metrics:
Primary Loyalty Indicators
- Repeat Purchase Intent: 84% of iPhone owners plan to purchase another Apple device²
- Brand Retention Rate: Percentage who repurchase the same brand when upgrading¹
- Net Promoter Score (NPS): Apple’s NPS stands at 61-72 as of 2024¹⁰,¹¹
- Trade-in Loyalty: Apple had 74.6% trade-in brand loyalty, Samsung 63.9%¹²
Customer Satisfaction Metrics
According to Statista’s Global Consumer Survey, 64% of iPhone users said they were very satisfied with their device, while 58% of Samsung users expressed the same level of satisfaction¹³.
Market Share and Loyalty Correlation (2025)
Global Market Share Q1 2025
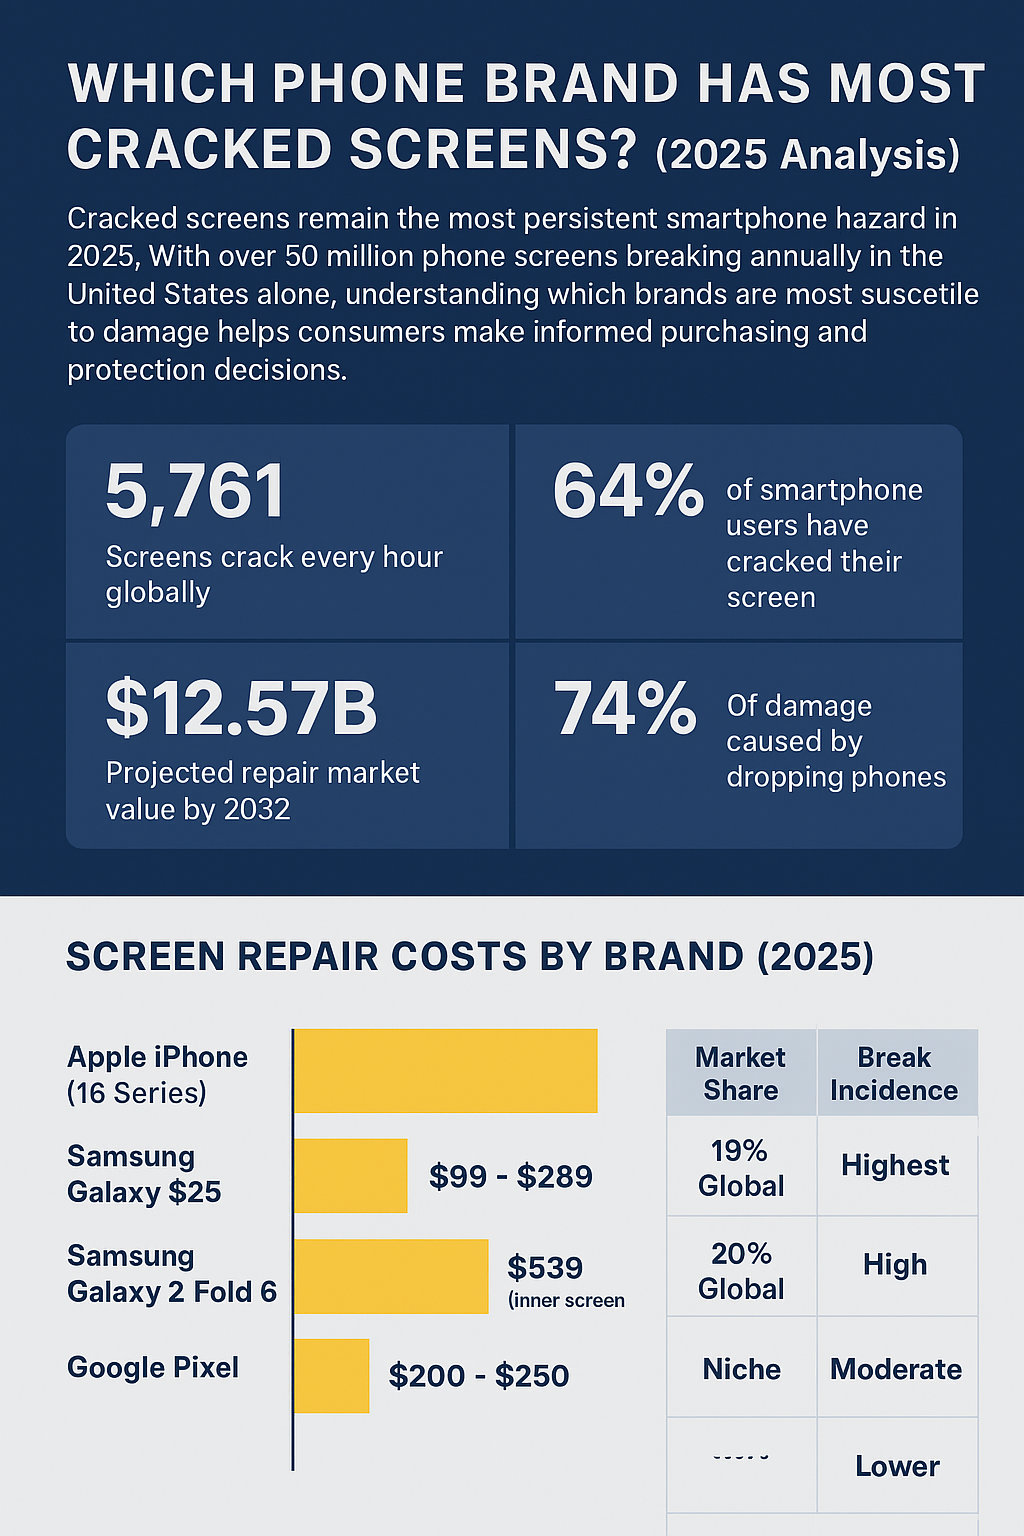
According to Canalys research, Q1 2025 global smartphone shipments reached 296.9 million units with the following distribution¹⁴:
| Rank | Brand | Q1 2025 Shipments | Market Share | YoY Growth |
|---|---|---|---|---|
| 1 | Samsung | 60.5 million | 20.4% | Stable |
| 2 | Apple | 55.0 million | 18.5% | +12% |
| 3 | Xiaomi | 41.8 million | 14.1% | +33% (5G) |
| 4 | Vivo | 22.9 million | 7.7% | +6.3% |
| 5 | OPPO | 22.7 million | 7.6% | Decline |
Key Highlights:
- Samsung maintained its leadership position with 60.5 million units shipped
- Apple achieved strong 12% YoY growth, driven by tariff-related stockpiling
- Xiaomi recorded impressive 33% growth in 5G segment
- Top 5 brands collectively account for 68.3% of global smartphone market
US Market Dominance
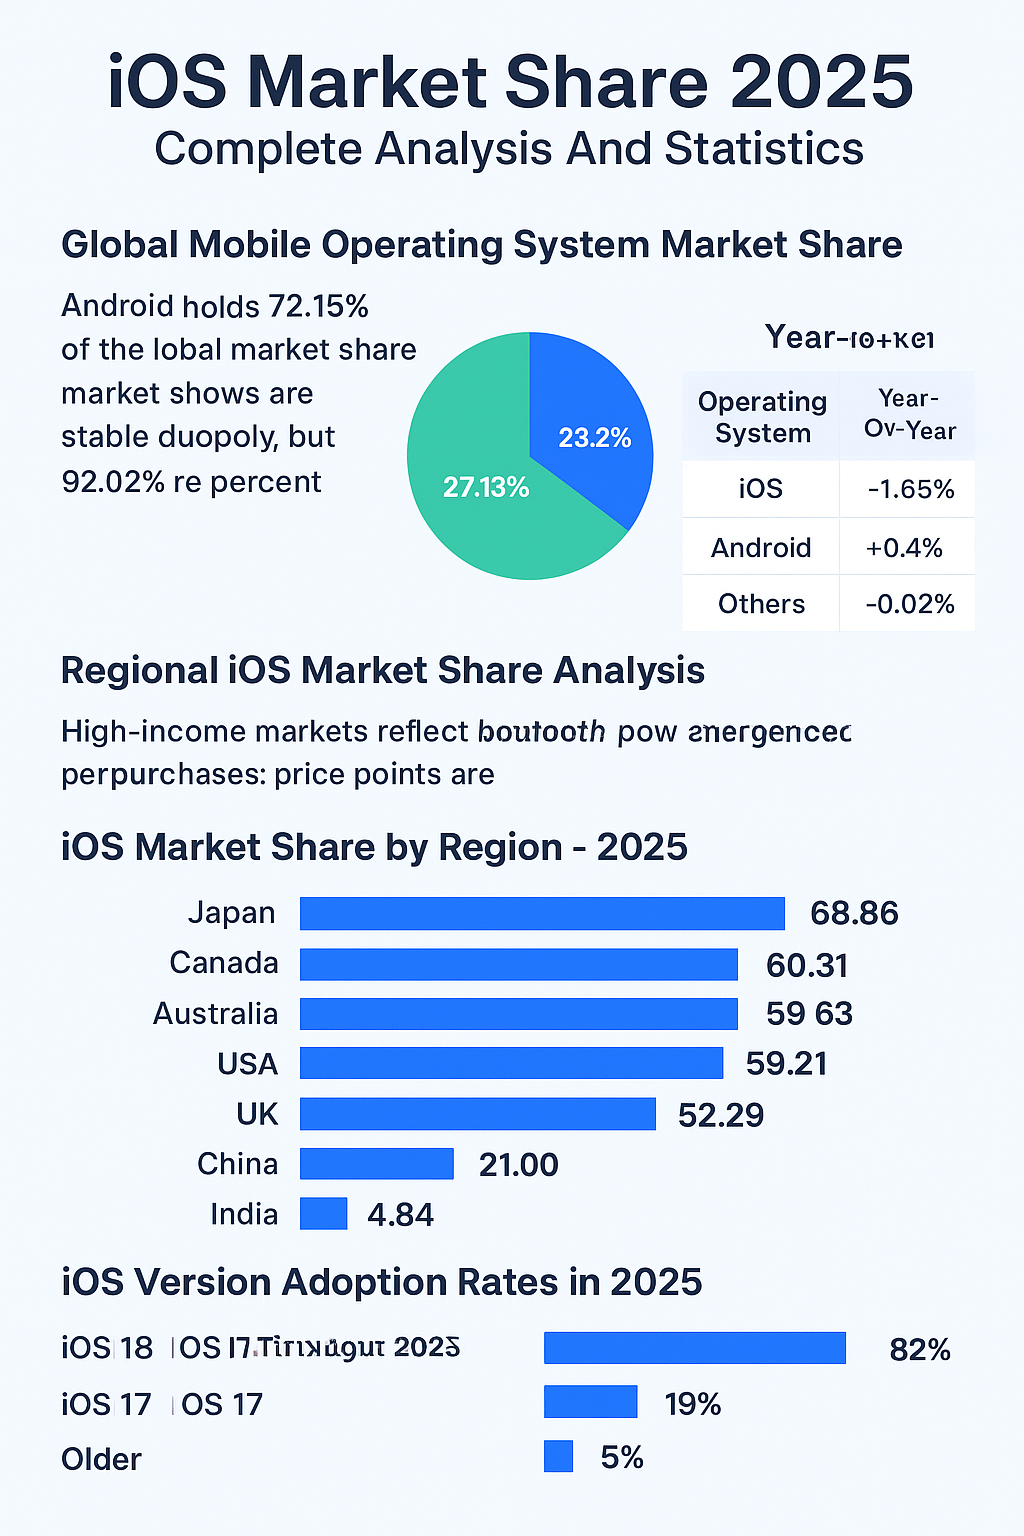
In the US market, Apple and Samsung command 83.89% combined market share, with Apple at 61.26% and Samsung at 22.63%⁶.
Age Demographics and Loyalty Patterns
| Age Group | iPhone Preference | Android Preference | Key Insights |
|---|---|---|---|
| 18-29 years | 44%¹⁵ | 30%¹⁵ | 84% of American teens prefer iPhones¹⁶ |
| 30-49 years | 48%¹⁵ | 43%¹⁵ | Peak iPhone adoption |
| 50+ years | Lower¹⁵ | Higher¹⁵ | Older generations prefer Android devices |
Teen Loyalty Factor: Among very young users, iPhone loyalty approaches 100%, as teens report it’s “considered uncool to use Android” and prefer using older iPhones over premium Android devices¹⁷.
Ecosystem Lock-in Effects
Apple Ecosystem Penetration
As of 2024, there are over 2.2 billion active Apple devices, and more than half of Apple users own multiple devices¹⁸.
| Device Type | Ownership Among iPhone Users |
|---|---|
| iPhone | 88% (baseline)¹⁶ |
| iPad | 73%¹⁶ |
| Apple Watch | 58%¹⁶ |
| Mac | 50%¹⁶ |
Key Finding: 60% of Apple customers own 3-4 Apple devices, creating strong ecosystem loyalty¹⁶.
Ecosystem Loyalty Drivers
76% of iPhone users stay loyal because of the seamless ecosystem integration¹⁶. Primary factors include:
- Seamless Data Sync: Cross-device continuity
- iMessage Integration: Social pressure and functionality
- High Resale Value: 80% of the refurbished smartphone market is captured by iPhones¹⁶
- Privacy Focus: 31.5% of Samsung users cite privacy concerns as the main reason for switching to iPhone⁷
Regional Loyalty Analysis
North American Market
North America recorded 8% YoY growth in Q1 2025, largely driven by Apple’s stockpiling ahead of potential tariff impacts¹⁴.
US Loyalty Breakdown:
- 48% of iPhone users say it’s unlikely they’ll change brands¹³
- 44% of Samsung users plan to stick with the company³
- Over 50% of Google Pixel users likely to switch brands³
Global Patterns
Asia-Pacific accounts for over half of global smartphone shipments, with Japan showing 29% YoY growth driven by Apple and Samsung demand.
What Drives Brand Loyalty
Apple Loyalty Factors
- Ecosystem Integration: Seamless device interconnectivity¹⁸
- Privacy Leadership: Growing privacy consciousness drives loyalty⁷
- Resale Value: Superior trade-in values¹²
- Customer Support: Omnichannel support including live chat, email, phone, Twitter, and YouTube channels¹⁸
- Social Status: Brand association with modernism, freedom, and youth²⁰
Samsung Loyalty Drivers
- Galaxy AI Features: Enhanced AI-powered experiences with Gemini integration²¹
- Display Technology: Industry-leading screen quality
- Price Diversity: Options across all price segments
- Innovation Leadership: Foldable technology and premium features²²
- Reduced Competition: Benefited from LG’s 2021 exit and fewer Android alternatives¹
Switching Patterns and Barriers
Cross-Platform Switching
Trade-in data reveals switching patterns: 12.8% of iPhone users switched to Samsung, while 17% of Samsung users picked up an iPhone¹².
Platform Retention
Operating system loyalty remains high: Android has a 91% retention rate compared to 86% for iOS¹⁵.
Barriers to Switching
- App Ecosystem Investment: Purchased apps and subscriptions
- Data Migration Complexity: Photos, contacts, and personal data
- Learning Curve: Familiarity with current interface
- Accessory Investment: Cables, cases, and ecosystem products
Economic Impact of Loyalty
Revenue Implications
Apple’s services revenue reached an all-time high of $85.8 billion in Q3 2024, driven largely by ecosystem loyalty¹⁸.
Customer Lifetime Value
- iPhone users are 21 times less likely to switch brands compared to Samsung users²
- Apple’s retention rate of 92% significantly exceeds Samsung’s 77%²
- iPhone users have a median annual salary of $53,251 vs $37,040 for Android users²³
Upgrade Cycle Trends
Extended Replacement Cycles
Only 62% of smartphone users owned phones released in the past three years in 2023, compared to 69% in 2022, indicating longer holding periods²⁴.
Premium Model Preference
iPhone 16 Pro and Pro Max shipments in 2024 were 11% higher than their predecessors, with consumers increasingly opting for premium variants²⁵.
| Model Category | Price Range | Upgrade Frequency | Loyalty Impact |
|---|---|---|---|
| Premium | $999+ | 3-4 years²⁴ | Highest loyalty |
| Mid-range | $400-800 | 2-3 years | Moderate loyalty |
| Budget | <$400 | 1-2 years | Lowest loyalty |
Future Loyalty Predictions (2025-2026)
- AI Integration: Low-cost 5G and GenAI diffusion in lower price segments are key trends for 2025¹⁴
- Foldable Adoption: Samsung’s continued leadership in foldable technology²²
- Privacy Regulations: European Digital Markets Act affecting Apple’s ecosystem control¹
- Economic Pressures: Tighter household budgets and slower upgrade cycles²⁴
Apple (2025-2026):
- Maintaining 85-90% loyalty despite economic headwinds¹
- iPhone 17 lineup faces slower upgrade cycles and regulatory changes¹
- Continued ecosystem expansion with Vision Pro and services
Samsung (2025-2026):
- Target: Reaching 80%+ loyalty through AI improvements
- Focus on Galaxy S25 series with deeper Gemini integration
- Foldable market leadership expansion²²
Google Pixel (2025-2026):
- Critical need to address loyalty challenges³
- AI-first approach with enhanced computational photography
- Must reverse trend of 50%+ user switching intent³
What’s Next?
The smartphone loyalty landscape in 2025 reflects a maturing market where ecosystem integration, economic value, and cutting-edge features determine long-term customer relationships.
While Apple continues to set the loyalty standard, Samsung’s strategic improvements and emerging AI capabilities suggest the competitive dynamics will continue evolving through 2026.
References
- Apple World Today. (2025, May 21). CIRP: Apple’s dominance in smartphone brand loyalty is no longer growing. Retrieved from https://appleworld.today/2025/05/cirp-apples-dominance-in-smartphone-brand-loyalty-is-no-longer-growing/
- Business Dasher. (2025, March 14). 9+ Apple Brand Loyalty Statistics: A Must-Know in 2024. Retrieved from https://www.businessdasher.com/apple-statistics/
- Statista. (2024). Chart: Google’s Smartphone Loyalty Problem. Retrieved from https://www.statista.com/chart/26001/smartphone-user-loyalty-by-brand-gcs/
- SAP Emarsys. (2024, October 14). 32 Customer Loyalty Statistics Your Business Needs to Know in 2025. Retrieved from https://emarsys.com/learn/blog/customer-loyalty-statistics/
- SellCell. (2021, March 16). Report: Brand loyalty at an all-time high of 92% for Apple as Android brands take a dive. Retrieved from https://www.sellcell.com/blog/cell-phone-brand-loyalty-2021/
- BankMyCell. (2025, January 4). US Smartphone Market Share (2025). Retrieved from https://www.bankmycell.com/blog/us-smartphone-market-share
- Counterpoint Research. Global Smartphone Market Share: Quarterly. Retrieved from https://www.counterpointresearch.com/insights/global-smartphone-share/
- Retently. (2024, August 22). The Reasons Behind Apple’s Customer Loyalty and High NPS. Retrieved from https://www.retently.com/blog/apple-nps/
- Coolest Gadgets. (2025, January 14). Apple Customer Loyalty Statistics By Region, Most Valuable Brands, Preferred Apple Device Model and Facts. Retrieved from https://www.coolest-gadgets.com/apple-customer-loyalty-statistics/
- Samsung Community. (2019, August 4). Apple, Samsung Customers Have Highest Brand Loyalty Among Smartphone Users. Retrieved from https://r2.community.samsung.com/t5/Others/Apple-Samsung-Customers-Have-Highest-Brand-Loyalty-Among/td-p/2006882
- Statista. Chart: How Happy And Loyal Are U.S. Smartphone Users? Retrieved from https://www.statista.com/chart/27694/satisfaction-and-brand-loyalty-among-us-smartphone-users/
- Canalys. (2025). Global smartphone market grew by a modest 0.2% in Q1 2025, despite regional declines. Retrieved from https://canalys.com/newsroom/worldwide-smartphone-market-q1-2025
- Netguru. (2025, March 26). iOS vs Android: Key Differences in 2025. Retrieved from https://www.netguru.com/blog/iphone-vs-android-users-differences
- AppleInsider. (2021, October 29). Apple has most loyal smartphone customers in US, study finds. Retrieved from https://appleinsider.com/articles/21/10/29/apple-has-most-loyal-smartphone-customers-in-us-study-finds
- ScienceDirect. Smartphone preferences and brand loyalty: A discrete choice model reflecting the reference point and peer effect. Retrieved from https://www.sciencedirect.com/science/article/abs/pii/S0969698919304990
- Canalys. (2025). Global smartphone market soared 7% in 2024 as vendors prepare for tricky 2025. Retrieved from https://canalys.com/newsroom/worldwide-smartphone-market-2024
- Coolest Gadgets. (2025, May 28). Samsung vs. Apple Smartphone Statistics – Which is Better? (2025). Retrieved from https://www.coolest-gadgets.com/samsung-vs-apple-smartphone-statistics/
- Bloomberg Intelligence. (2023, October 5). Despite Stagnant Unit Sales, Apple Loyalty and High-End Adoption May See Apple Revenue in the US Grow in FY24. Retrieved from https://www.bloomberg.com/company/press/despite-stagnant-unit-sales-apple-loyalty-and-high-end-adoption-may-see-apple-revenue-in-the-us-grow-in-fy24-finds-bloomberg-intelligence/


