Jamie
Jamie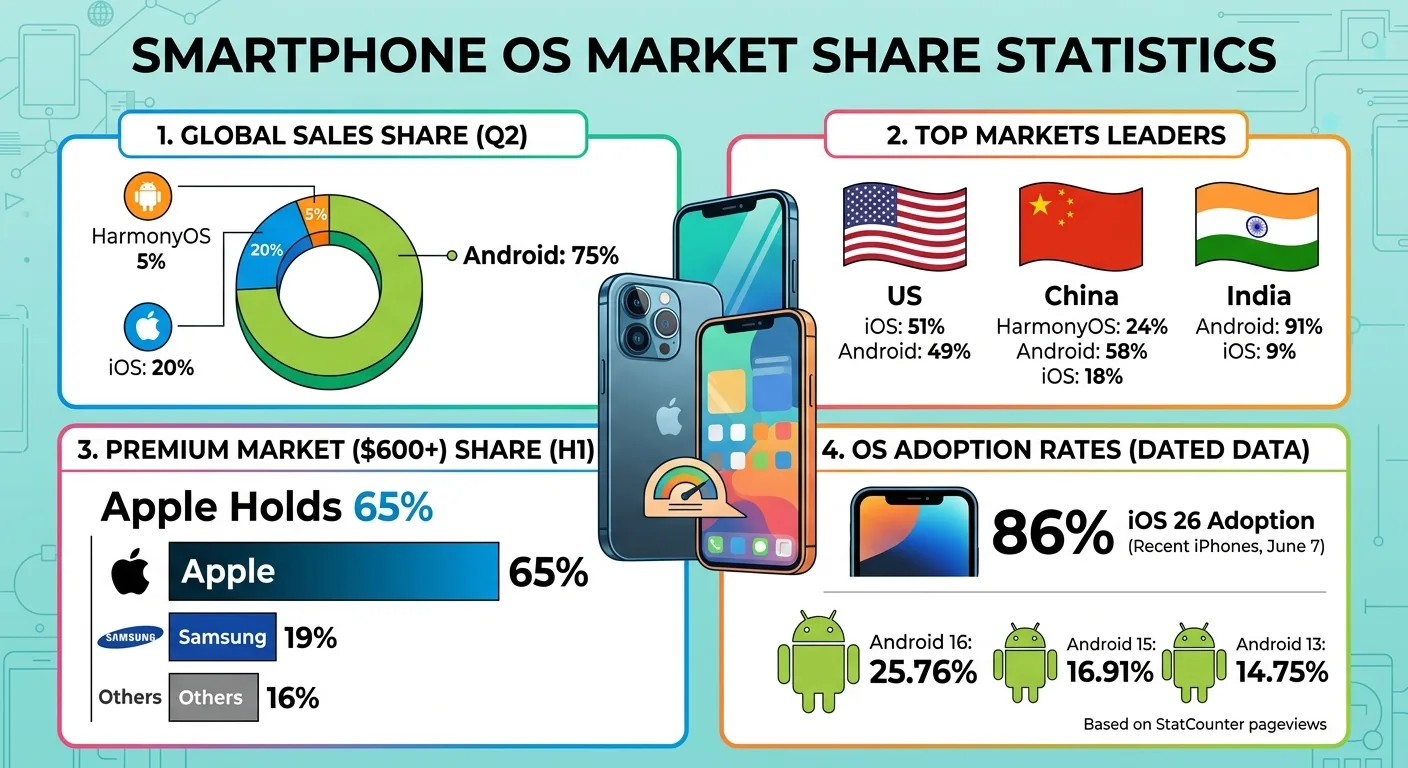
Android took 75% of global smartphone sales in Q2 2026, against 20% for iOS and 5% for HarmonyOS, based on Counterpoint Research data. StatCounter’s web-traffic count puts Android lower, at 69.17% of mobile pageviews in September 2026.
This guide covers smartphone OS market share by sales, shipment forecasts, pageviews, country, price tier and software version, with each figure dated.
Smartphone OS Market Share
Android 75%, iOS 20%: Smartphone OS Market Share by Sales in Q2 2026
Android’s global sales share stood at 75% in Q2 2026, down from 79% in Q2 2025. iOS rose from 17% to 20% over the same twelve months.
iOS peaked at 24% in Q4 2025, then eased to 22% in Q1 2026 and 20% in Q2 2026. HarmonyOS held between 3% and 5% across all five quarters.
The Q4 2025 shares sum to 99% as published.
Source: Counterpoint Research, Global Smartphone Sales Share by Operating System, Q2 2025 to Q2 2026 (updated August 2026)
Which OS Leads Smartphone Sales in the US, China and India?
iOS edged Android in the US in Q2 2026, 51% to 49%. In China, HarmonyOS outsold iOS 24% to 18%, while Android held 58%.
| Market | Android | iOS | HarmonyOS |
|---|---|---|---|
| United States | 49% | 51% | Not reported |
| China | 58% | 18% | 24% |
| India | 91% | 9% | Not reported |
Source: Counterpoint Research, smartphone sales share by OS, Q2 2026
India was the most Android-heavy of the three markets, with iOS at 9% of sales.
How Is the 2026 Memory Shortage Changing OS Shipment Share?
IDC expects Android shipments to fall 24.3% in 2026, while iOS shipments slip 1.3%. In that model, Android loses seven points of share and iOS climbs to a record 23.6%.
IDC ties the split to memory costs. NAND and DRAM prices are up over 300% YoY, and IDC forecasts the average smartphone price will rise 27.6% to $581.
| Segment | 2026 forecast, shipment change YoY |
|---|---|
| Worldwide smartphones | -16.7% |
| Android | -24.3% |
| iOS | -1.3% |
| Second half of 2026, all smartphones | -27.2% |
| Foldables | +12.6% |
Source: IDC Worldwide Quarterly Mobile Phone Tracker, 2026 forecast, August 26, 2026
HarmonyOS runs against the trend. IDC projects its 2026 volume will almost triple to 51 million units as Huawei gains share in China.
Foldables, a category that includes devices such as the Xiaomi Mix Fold 4, are the only segment IDC sees growing, to 22.9 million units. IDC credits Apple’s entry in the second half of 2026.
IDC’s 2026 outlook has widened with each release this year: a 12.9% decline in February, 13.9% in May and 16.7% in August. The August figure is the steepest annual contraction on record, per IDC.
The May forecast put iOS at 22% of 2026 shipments. IDC’s August 28 release on Q2 shipments still described Apple as on track for a record 22% annual share.
Source: IDC smartphone forecasts, February, May and August 2026; IDC Q2 2026 release, August 28, 2026
Smartphone OS Market Share by Web Traffic and Country
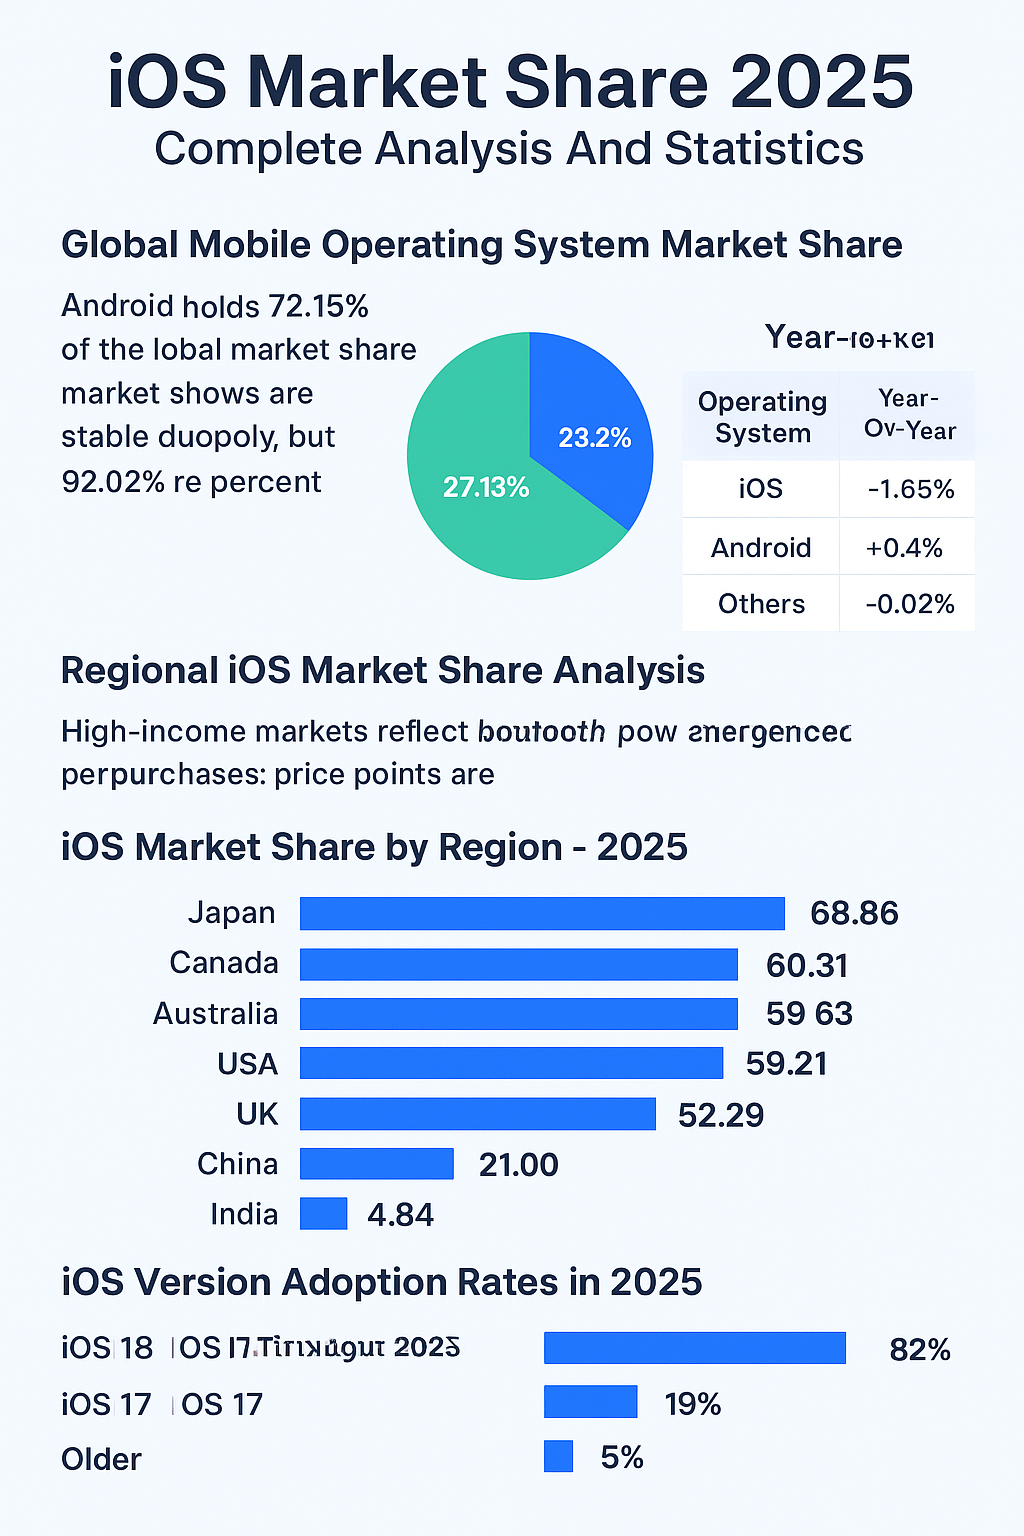
Android accounted for 69.17% of worldwide mobile web pageviews in September 2026, and iOS for 30.81%. Linux and KaiOS each registered 0.01%.
Source: StatCounter Global Stats, mobile OS market share worldwide, September 2026
StatCounter samples over 3 billion pageviews a month. Its figures track browsing activity, not units sold or people.
| Country | Android | iOS |
|---|---|---|
| United States | 39.29% | 60.68% |
| Japan | 35.25% | 64.74% |
| China | 71.34% | 28.58% |
| India | 92.79% | 7.15% |
Source: StatCounter Global Stats, mobile OS pageview share by country, August 2026
Japan and the US lean toward iOS in pageviews. India sits at the other end, with iOS at 7.15%.
Samsung and Apple Were the Only Top-5 Vendors to Grow in Q2 2026
Global smartphone shipments fell 7.4% YoY to 276.3 million units in Q2 2026, IDC reported. Apple’s total maps to iOS; the other four top vendors ship Android-based phones.
| Company | 2Q26 shipments (M) | 2Q26 share | 2Q25 shipments (M) | 2Q25 share | YoY change |
|---|---|---|---|---|---|
| Samsung | 62.7 | 22.7% | 58.0 | 19.4% | 8.1% |
| Apple | 55.7 | 20.2% | 48.5 | 16.3% | 14.9% |
| Xiaomi | 31.2 | 11.3% | 42.4 | 14.2% | -26.4% |
| OPPO | 28.9 | 10.5% | 34.9 | 11.7% | -17.1% |
| vivo | 21.2 | 7.7% | 26.3 | 8.8% | -19.6% |
| Others | 76.6 | 27.7% | 88.2 | 29.6% | -13.1% |
| Total | 276.3 | 100.0% | 298.3 | 100.0% | -7.4% |
Source: IDC Quarterly Mobile Phone Tracker, Q2 2026 final historical data, August 6, 2026
Shipments of Apple’s iPhone lineup rose 14.9% to 55.7 million, lifting its share to 20.2%.
Samsung grew 8.1% to 62.7 million units and held first place at 22.7%.
Xiaomi posted the steepest fall in the top five at -26.4%. IDC says the company is trimming low-end volume to protect profitability.
Huawei, outside the top five, grew 19.9% YoY in Q2 2026, according to IDC.
Source: IDC, Q2 2026 smartphone shipment release, August 28, 2026
Premium Smartphone OS Market Share: Apple Holds 65% Above $600
Apple took 65% of global premium smartphone unit sales in H1 2026, up from 63% in H1 2025 but below 74% in H1 2022. Samsung held 19%.
Counterpoint defines premium as phone models with a wholesale price of $600 and above. Apple’s premium unit sales grew 9% YoY in H1 2026.
Counterpoint attributes Apple’s share loss since 2022 to tougher competition in China, the largest premium market.
| Period | Premium share of global smartphone unit sales |
|---|---|
| H1 2022 | 20% |
| H1 2025 | 25% |
| H1 2026 | 29% |
Source: Counterpoint Research, Global Handset Model Sales Tracker, H1 2026 (released August 4, 2026)
Apple and Samsung together held 84% of the segment in H1 2026, up from 82% in H1 2025.
How Fast Do New iOS and Android Versions Spread?
iOS 26 ran on 79% of all iPhones that transacted on the App Store on June 7, 2026. Among iPhones introduced in the last four years, the figure was 86%.
| Device group | Share on iOS 26 / iPadOS 26 |
|---|---|
| iPhone, all devices | 79% |
| iPhone, introduced in last four years | 86% |
| iPad, all devices | 68% |
| iPad, introduced in last four years | 79% |
Source: Apple Developer, iOS and iPadOS usage, measured June 7, 2026
Apple reported an installed base of more than 2.5 billion active devices across all product lines with its fiscal Q1 2026 results.
Source: Apple, fiscal 2026 first-quarter results, January 29, 2026
Android Version Share in August 2026
Android 16 led with 25.76% of Android mobile and tablet pageviews in August 2026. Android 15 followed at 16.91%.
| Android version | Share of Android pageviews |
|---|---|
| 16.0 | 25.76% |
| 15.0 | 16.91% |
| 13.0 | 14.75% |
| 14.0 | 13.09% |
| 12.0 | 10.07% |
| 11.0 | 8.31% |
Source: StatCounter Global Stats, Android version share, mobile and tablet, worldwide, August 2026 (top six versions listed)
Android 13 still ranked above Android 14 in this reading. Apple counts App Store transacting devices while StatCounter counts pageviews, so the two version figures are not directly comparable.
FAQs
What is the Android vs iOS market share in 2026?
Android held 75% of global smartphone sales in Q2 2026, iOS 20% and HarmonyOS 5%, per Counterpoint. By web traffic, StatCounter put Android at 69.17% and iOS at 30.81% of mobile pageviews in September 2026.
Is iPhone more popular than Android in the US?
Yes, on both main measures. iOS took 51% of US smartphone sales in Q2 2026, per Counterpoint, and 60.68% of US mobile pageviews in August 2026, per StatCounter.
Has HarmonyOS overtaken iOS in China?
In sales, yes. HarmonyOS reached 24% of China smartphone sales in Q2 2026 against 18% for iOS, per Counterpoint Research. Android led the market with 58%.
Why do Reddit threads quote different Android vs iOS market share numbers?
Trackers count different things. Counterpoint measures quarterly sales (Android 75%, Q2 2026), StatCounter measures web pageviews (Android 69.17%, September 2026), and IDC measures shipments. Each figure is valid only for its own measure.
Will iOS market share grow in 2026?
IDC’s August 2026 forecast puts iOS at a record 23.6% of 2026 smartphone shipments, up almost four points. It expects iOS shipments to slip 1.3% while Android shipments fall 24.3%.
Sources
https://gs.statcounter.com/os-market-share/mobile/worldwide
https://counterpointresearch.com/en/insights/global-smartphone-os-market-share