Jamie
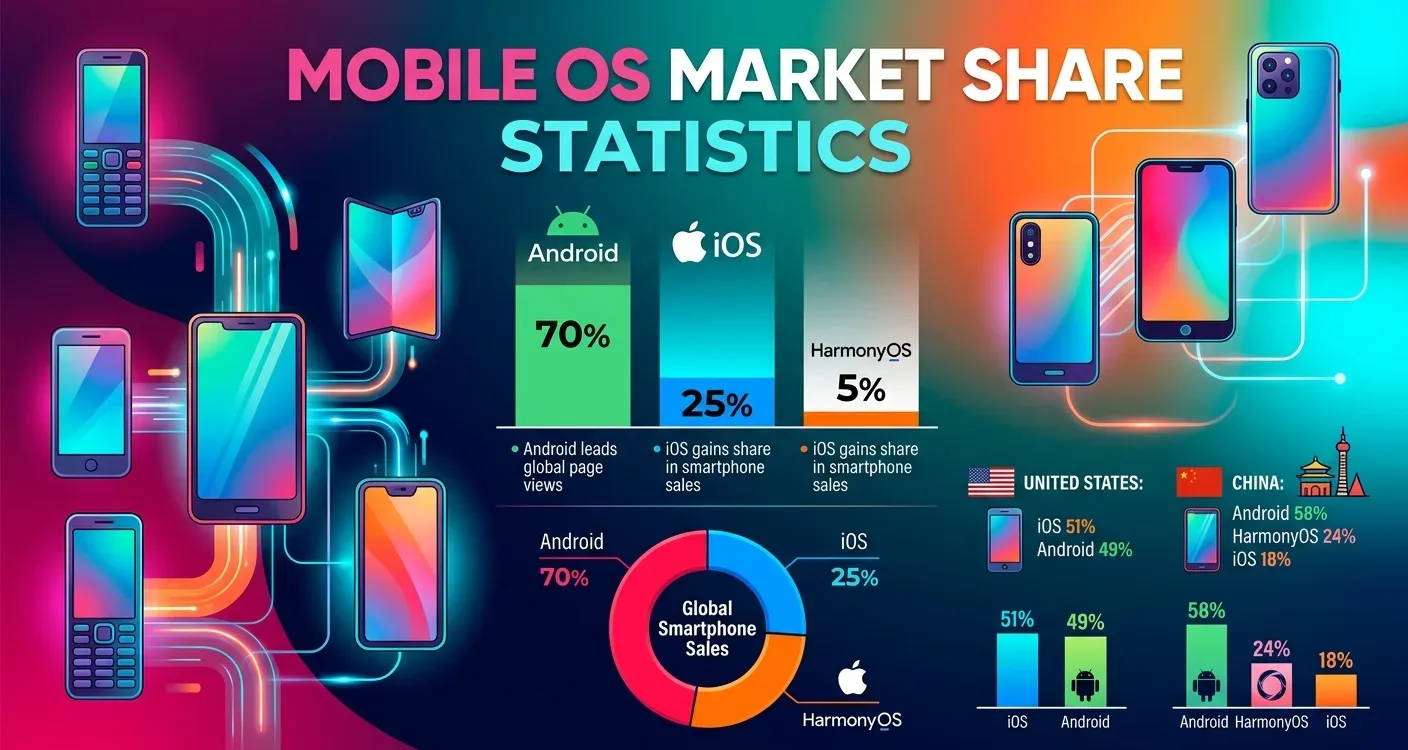
Android’s lead in mobile OS market share depends on the yardstick. Statcounter put it at 69.17% of worldwide mobile page views in September 2026.
Counterpoint Research counted 75% of global smartphone sales for Android in Q2 2026. The sections below cover monthly page views, quarterly sales in the US, China and India, vendor shipments and IDC’s 2026 forecast.
Mobile OS Market Share
Android Holds 69.17% of Mobile OS Market Share by Page Views
Statcounter recorded Android on 69.17% of worldwide mobile page views in September 2026. iOS took 30.81%, and Linux and KaiOS logged 0.01% each.
The panel behind these figures samples more than 3 billion page views a month. It tracks browsing on Google’s Android and Apple’s iOS, not people or devices in use.
| Month | Android | iOS |
|---|---|---|
| July 2026 | 68.36% | 31.6% |
| August 2026 | 67.61% | 32.36% |
| September 2026 | 69.17% | 30.81% |
Source: Statcounter Global Stats, mobile OS market share worldwide, July to September 2026
iOS rose from 31.6% in July to 32.36% in August, then dropped to 30.81% in September. Android went from 68.36% to 67.61% before returning to 69.17%.
Mobile OS Market Share in Smartphone Sales, 2024 to 2026
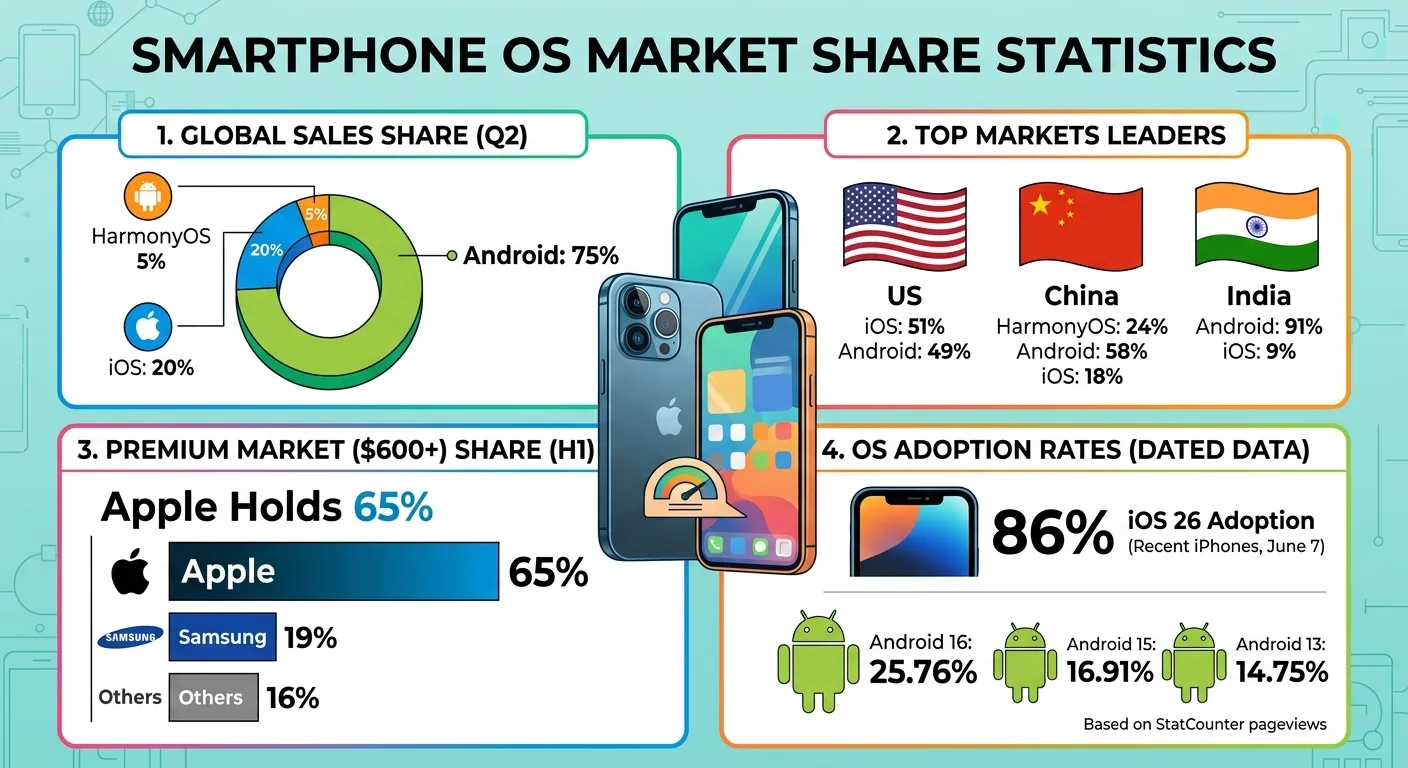
Counterpoint Research put Android at 75% of global smartphone sales in Q2 2026. iOS took 20% and HarmonyOS 5%.
A year earlier, in Q2 2025, the split stood at 79%, 17% and 4%. Across the eight quarters charted, iOS ranged from 16% in Q3 2024 to 24% in Q4 2025.
Counterpoint described 20% as the highest June-quarter share iOS has recorded, citing demand for the iPhone 17 series and the iPhone 17e launch.
Total smartphone sales fell 11% year over year in Q2 2026, per the same report. The drop was steepest in entry-level and mid-tier phones, Counterpoint said.
Source: Counterpoint Research, Global Smartphone Sales Share by Operating System, Q3 2024 to Q2 2026 (published August 2026)
iOS Sales Share, Q2 2025 vs Q2 2026
iOS gained share in each of the four markets Counterpoint reports when Q2 2026 is set against Q2 2025.
| Market | iOS, Q2 2025 | iOS, Q2 2026 |
|---|---|---|
| Global | 17% | 20% |
| United States | 50% | 51% |
| China | 16% | 18% |
| India | 6% | 9% |
Source: Counterpoint Research, smartphone sales share by operating system, Q2 2025 and Q2 2026
India remained the most Android-heavy of the three country markets, with Android on 91% of Q2 2026 sales.
US Sales: iOS at 69% in Q4 2025, 51% in Q2 2026
iOS took 69% of US smartphone sales in Q4 2025, 58% in Q1 2026 and 51% in Q2 2026. Android held 49% in the latest quarter.
A year earlier the pattern looked similar: iOS reached 65% in Q4 2024, then 55% in Q1 2025 and 50% in Q2 2025.
Source: Counterpoint Research, US smartphone sales share by operating system, Q3 2024 to Q2 2026
China Sales: HarmonyOS Reached 24%
HarmonyOS took 24% of China smartphone sales in Q2 2026, up from 19% in Q1 2026. iOS held 18% and Android 58%.
Counterpoint credited local component sourcing, which it said insulated Huawei from rising component prices, plus sales of the Huawei Enjoy 90 Pro Max.
Source: Counterpoint Research, China smartphone sales share by operating system, Q3 2024 to Q2 2026
Why Do Trackers Disagree on Mobile OS Market Share?
Each tracker counts a different event over a different period. A page view, a phone sold and a phone shipped are three separate measurements.
| Tracker | What it counts | Frequency | Latest release used |
|---|---|---|---|
| Statcounter Global Stats | Sampled mobile web page views | Monthly | September 2026 |
| Counterpoint Research | Smartphone sales | Quarterly | Q2 2026 |
| IDC | Branded new smartphones shipped, refurbished units excluded | Quarterly | Q2 2026, final data |
Source: Statcounter Global Stats (September 2026), Counterpoint Research (Q2 2026), IDC Worldwide Quarterly Mobile Phone Tracker table notes (Q2 2026)
Version and price-tier splits for the same platforms are covered in this smartphone OS market share breakdown.
Counterpoint reported Q2 2026 smartphone sales down 11% year over year. IDC reported Q2 2026 shipments down 7.4%.
In the US, Statcounter had iOS at 53.59% of mobile page views in September 2026. Counterpoint put iOS at 51% of US smartphone sales in Q2 2026.
iOS Takes 60.51% in Japan: Android vs iOS by Country
Japan and the United States were the two iOS-majority markets among those checked for September 2026. Longer-run Apple figures sit in this iOS market share analysis.
| Market | Android | iOS |
|---|---|---|
| Japan | 39.49% | 60.51% |
| United States | 46.39% | 53.59% |
| Worldwide | 69.17% | 30.81% |
| India | 93.89% | 6.05% |
Source: Statcounter Global Stats, mobile OS share of page views by market, September 2026
India sat at the other end, with Android on 93.89% and iOS on 6.05%. KaiOS registered 0.04% of Indian mobile page views.
Statcounter recorded iOS at 58.35% of US mobile page views in June 2026, against 53.59% in September.
Source: Statcounter Global Stats, United States mobile OS market share, June and September 2026
Which Phone Makers Shipped the Most in Q2 2026?
IDC counted 276.3 million smartphones shipped worldwide in Q2 2026, down 7.4% from 298.3 million a year earlier. Apple was the sole iOS vendor in the top five.
Samsung led with 62.7 million units and a 22.7% share. Apple followed with 55.7 million units and 20.2%, which IDC called record second-quarter shipments for the company.
The two leaders were the sole top-five vendors to grow, by 8.1% and 14.9%. IDC tied the gap to memory costs, which it said were up almost 300% from a year earlier.
| Company | Q2 2026 shipments (M) | Q2 2025 shipments (M) | YoY change |
|---|---|---|---|
| Samsung | 62.7 | 58.0 | 8.1% |
| Apple | 55.7 | 48.5 | 14.9% |
| Xiaomi | 31.2 | 42.4 | -26.4% |
| OPPO | 28.9 | 34.9 | -17.1% |
| vivo | 21.2 | 26.3 | -19.6% |
| Others | 76.6 | 88.2 | -13.1% |
| Total | 276.3 | 298.3 | -7.4% |
Source: IDC Worldwide Quarterly Mobile Phone Tracker, Q2 2026 final data, August 28, 2026
Xiaomi posted the steepest fall in the top five at -26.4%. IDC said the company is trimming low-end volume to protect profitability.
Huawei, outside the top five, grew shipments 19.9% year over year, per IDC.
Source: IDC, Q2 2026 smartphone shipment release, August 28, 2026
IDC’s 2026 Outlook for Mobile OS Market Share
IDC forecasts worldwide smartphone shipments will fall 16.7% in 2026, to just over 1 billion units. The firm calls it the steepest annual contraction on record.
| Platform | Forecast shipment change, 2026 |
|---|---|
| All smartphones | -16.7% |
| Android | -24.3% |
| iOS | -1.3% |
Source: IDC Worldwide Quarterly Mobile Phone Tracker, 2026 forecast, August 2026
In that forecast, Android loses seven points of share and iOS reaches a record 23.6% of shipments. IDC’s August 28 release on Q2 shipments separately described Apple as on track for a record 22% annual share.
Book-style foldables are the one segment IDC sees growing, up 12.6% to 22.9 million units. IDC credits Apple’s entry in the second half of 2026.
HarmonyOS volume will almost triple to 51 million units in 2026, IDC projects, as Huawei gains share in China.
The average smartphone selling price rises 27.6% to $581 in IDC’s model, up from the $550 it projected a quarter earlier.
Source: IDC, worldwide smartphone forecast, August 2026
FAQs
What percentage of phones run Android vs iOS?
Of smartphones sold in Q2 2026, 75% ran Android, 20% iOS and 5% HarmonyOS, per Counterpoint Research. Statcounter’s page-view count, a separate measure, put Android at 69.17% in September 2026.
Does iOS or Android lead in the United States?
iOS leads on both main measures. It took 53.59% of US mobile page views in September 2026, per Statcounter, and 51% of US smartphone sales in Q2 2026, per Counterpoint.
Which country has the highest iOS market share?
Japan, among the markets covered here. iOS took 60.51% of Japanese mobile page views in September 2026, per Statcounter, ahead of the United States at 53.59%.
What is the third-largest mobile operating system?
HarmonyOS, based on Counterpoint’s sales data. It took 5% of global smartphone sales in Q2 2026, behind Android at 75% and iOS at 20%, and 24% of sales in China.
Which source should I cite in a Reddit thread about Android vs iOS share?
Match the tracker to the claim. Use Statcounter for monthly mobile page views, Counterpoint Research for quarterly sales and IDC for vendor shipments, and quote the period, such as September 2026 or Q2 2026.
Sources
https://gs.statcounter.com/os-market-share/mobile/worldwide
https://counterpointresearch.com/en/insights/global-smartphone-os-market-share